


Is the Nasdaq in a Reflexive Bubble?
The dogma of passive investing and the A.I. rush. Think Blockchain 50X.
Last week I wrote a small piece on the rush into A.I. — backed mainly from VC money. This was triggered by the launch of Chat GPT near the end of 2022, and by the effect the launch had on A.I-related share price valuations. The A.I. rush had begun then and there.

Today I will be digging deeper into the dogma of passive investing, the NASDAQ 100 constituents and their valuations, and investigate whether said index is in a reflexive bubble.
The theory of reflexivity was developed by George Soros and it is a framework for understanding far-from-equilibrium conditions in financial markets. Far-from-equilibrium conditions arise when positive feedback loops exist between prices and the fundamentals (that they are supposed to passively reflect).
Before we get to the A.I. bubble part of this post, let’s talk a bit about passive investing and its rise and rise.
“Passive” Investing
Nowadays, even the last market participant knows that passive investing is the way to go…
Some say they prefer passive because the efficient-market hypothesis (EMH) holds - which means no one can beat the market. Others are simply disillusioned with the performance of active management and just threw in the towel as the Nasdaq and S&P500 (“the indices”) continued to rally against all odds.
Well, I take offence with this intellectual dishonesty. Firstly, the market is definitely not efficient and instead of spending time to refute the EMH, for the sake of my readers I will cite the bullshit asymmetry principle1 and be done with it.
Additionally, I ask you, what merit is there to look at the “average” active manager and make decisions off of those findings? Actually, you aren’t even making decisions, you are looking at the results in hindsight and picking and choosing where you would rather be. Ridiculous!
Passive Management cannot be compared to Active Management, and should never be. We are talking about two completely different styles of investing, with different objectives.
Passive performance is what everyone likes to talk about when it’s going well, and lie to their friends that they never dumped their QQQ ETF when the market tanked in 2020.
Active is a whole other animal, it can be hell in fact.
If you are an active manager your investors will 1) Compare you to the indices when the indices are over-performing. 2) Say nothing to you when you are over-performing. 3) Reference the fees they pay to be long the SPY ETF when you talk about fees with them, and by the way they are never long the indices because they are either too expensive or it’s a recession. 4) When the markets are dropping they will call you 3 times a week asking you what risks do you see in the horizon, what the ultimate downside is and why are you still holding XYZ stock? 5) If the markets continue crashing they will come back to get their moral victory, and if markets bounce back they will either get lost for a bit or ask you why you won’t sell some on the bounce.
These “investors” will listen to you for hours talking about single stocks and their 5 to 10 year prospects, and they will be excited with you as long as the stock is moving up. On the first sign of weakness, they will come back to breathe down your neck until you have second thoughts and start doubting yourself and your strategy.
These same people are the people who will still compare you to the indices at the end of the year, even if you would have performed better if they hadn’t hijacked you. My point is: don’t talk about passive investing if you can’t even practice it yourself.
Now that I have concluded my mini rant, let’s have a look at the Nasdaq and how it returned almost 4.5X in the past decade.
The Nasdaq 100
Its top 20 constituents make up 62.5% of the index and they are concentrated in Tech and Semi names. I created the table below to give us a visual representation of the Nasdaq top 20 and how share prices have performed relative to Earnings per Shares (EPS) growth.
You will observe that some figures are negative like for Tesla, Intel and AMD which is because EPS is lower now than it was 10 years ago. This skews the Multiplier making it harder to make cheapness comparisons, but no one said this tactic is perfect.
For names like Amazon, which had faster EPS growth than Share Price Growth (i.e. it was more expensive then, relative to now), just look at the P/E figure to assess relative valuation.
We can easily see from the far-right column that most of these names are richly priced — potentially making them very bad investments in case something were to go wrong. —> “Business Risk” it used to be called, now it’s long forgotten.
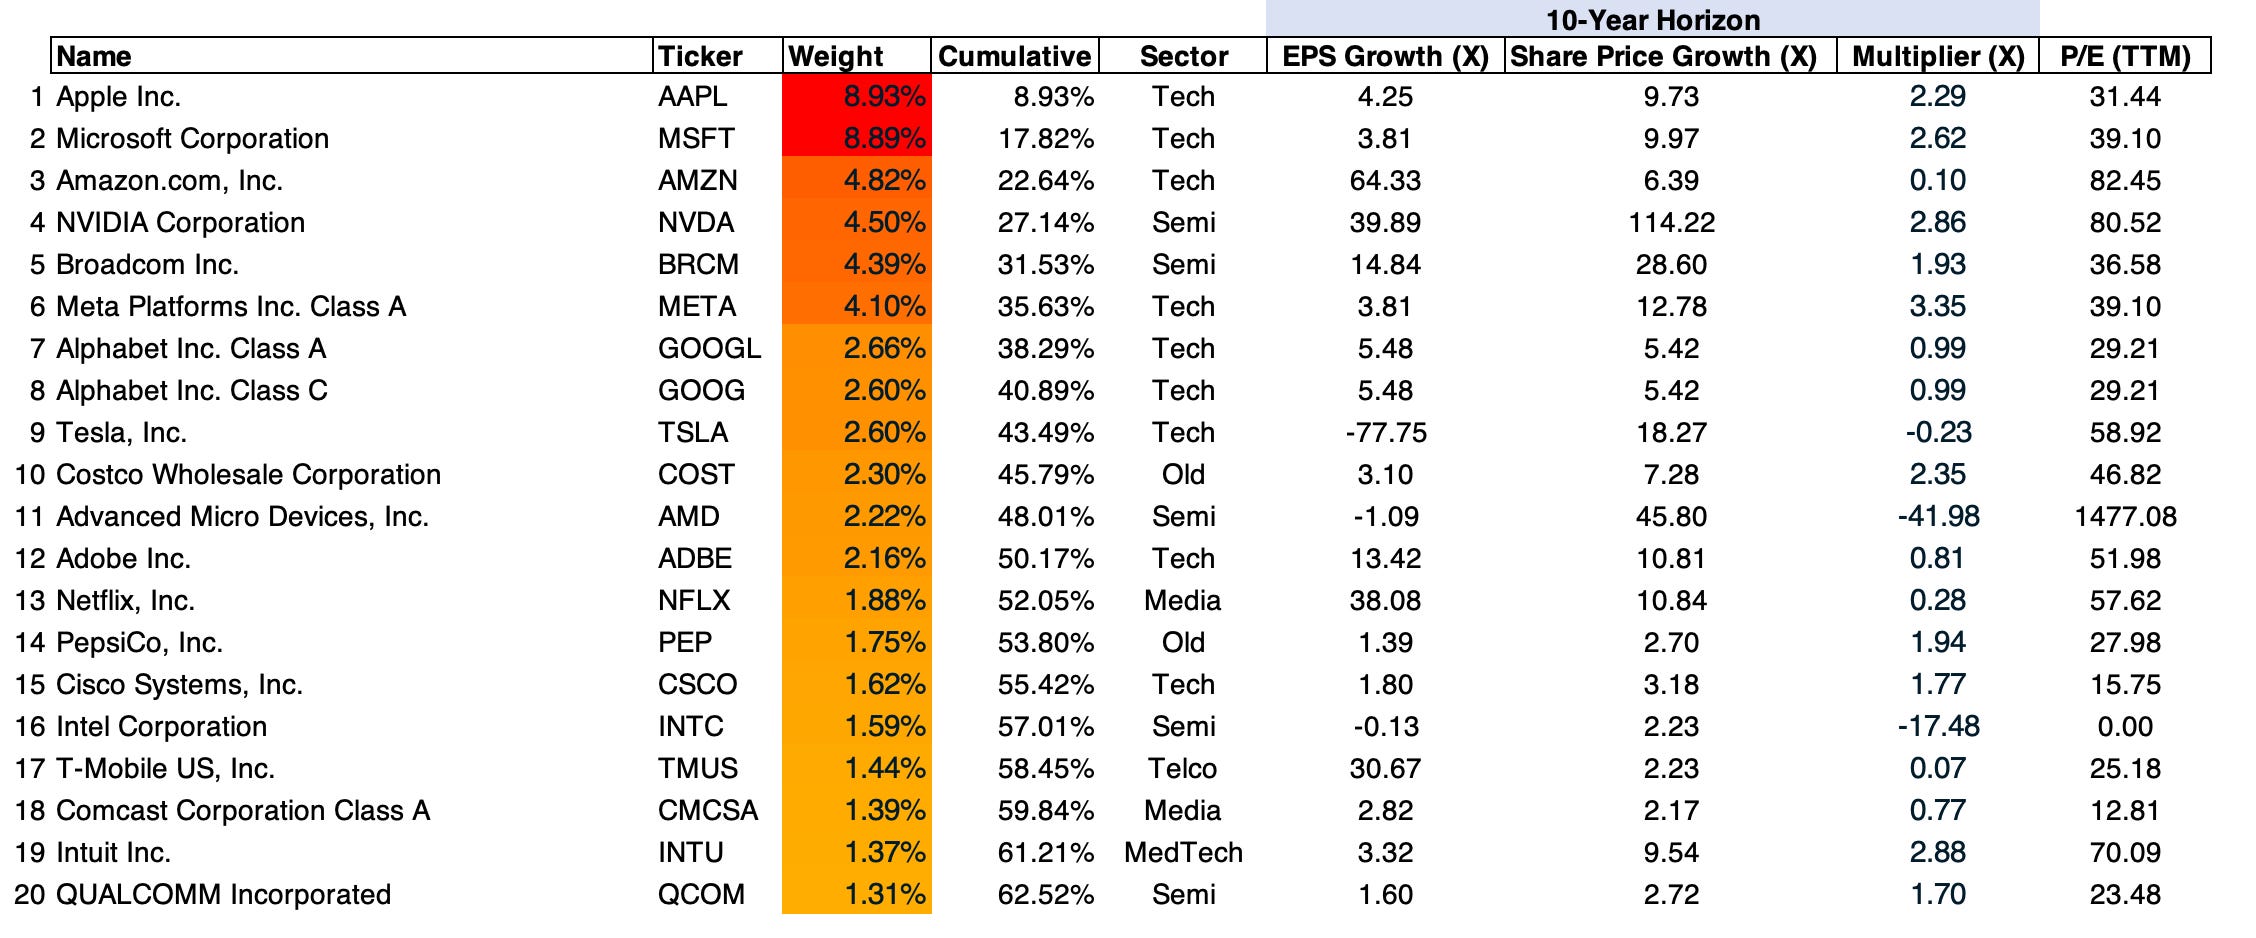
Out of the top 62.5%, only 4% is unrelated to the technological revolution. This can only mean one thing — that being long the Nasdaq 100 is being long technology and innovation*.
OR IS IT?
Well, it gets complicated. Passive is not as passive as people might think. Buying a portfolio of stocks and keeping it forever does not guarantee you great returns over time — simply because you choose to diversify and ignore your portfolio.
In fact what happened was that the past two decades were the age of the technological revolution — with an increased need for semiconductors, processing power, data centers, enterprise software, smartphones, online search and advertising, cloud services and the overarching themes of digitalisation and the attention economy; naturally technology has done well.
Does buying the Nasdaq 100 today promise you similar results? Of course not. Do investors seem to think so? Absolutely.
Long Optionality
Being long a broadly-diversified portfolio with dynamic companies that you plan never to trade makes you long optionality — and it makes you long optionality because even if only 10% or 20% of your portfolio companies achieve a 10X or 20X in a decade, your overall portfolio returns will be incredibly good.
But optionality is anything but a linear concept, for example, optionality can be cheap and optionality can be expensive.
Ten years ago, Apple was selling for roughly 10x earnings. Today, after massive growth in all their segments and arguably world domination, it’s selling for ~30x earnings. You could say that Apple will start selling cars, and grow in other segments and this and that — but chances are you will have a very hard time proving that being long Apple today is better (or even comparable) to being long Apple 10 years ago.
Chances are you will have the same hard time arguing the same for most of the top 20 Nasdaq 100 constituents. Fact of the matter is, these companies have started to sell for higher valuations (using a simple P/E ratio) as they have matured and grown bigger. A business-oriented investor could argue that companies tend to hit ceilings as they mature.
Ok Philo, but it doesn’t matter because winner takes all…
Winner-takes-all you say?
There is something different about big winners these days — when compared to the dominant stocks of previous cycles. In the olden days, the stock market was dominated by companies like Citigroup, Caterpillar, US Steel, Dow Chemical and Coca Cola.
These companies are old economy-type businesses, falling prey to the capitalistic law of gravity: “You can’t get exponential profit growth without exponential capex growth.”
But today, the Nasdaq 100 is dominated by companies like Apple, Microsoft, Alphabet, Nvidia and Meta — all new economy-type businesses which don’t really suffer from the capitalistic law of gravity.
As a consequence of that (and many other reasons), and because relative SIZE is a massive advantage for global domination, as well as the fact that the dominant incumbent tends to maintain dominance of that market — investors tend to price these companies very differently.
Business is so much more dynamic today, making it easy to believe that Apple or Google could one day completely dominate their respective markets. We won’t get into a philosophical discussion on why that may or may not be the case, but let’s just say change is a constant and total domination is harder than it seems.
In the case of Google, which owns >90% of the online search market (an incredible feat), its moat is already eroding as the rise of A.I. chatbots could be the platform for a change in user behaviour.
What makes us so sure that the increasingly competitive A.I. chatbot market won’t pivot to an ad-based model, where Google will start to lose share of the online ads market fast?
Put more simply
“Price is what you pay value is what you get.” Warren Buffet
“In the business world, the rear view mirror is always clearer than the windshield.” Warren Buffett
"The investor of today doesn’t profit from yesterday's growth." Warren Buffett
“It is a constant feature of the investment landscape that people applaud recent gains when they should be thinking more about the future.” Nick Sleep
“You don’t get paid for what’s already happened. You only get paid for what’s going to happen in the future. The past is only useful to you in the extent to which it gives you insights into the future, and sometimes the past doesn’t give you any insights into the future.” Warren Buffett
“Typically, analysts evaluating the future prospects of a company look at its past. Where else can you look after all? And yet, even if they had a perfect snapshot of the past, they would be mistaken to assume that the conditions that held in the past will hold in the present or future.” Leon Levy
“You can’t see the future through a rearview mirror.” Peter Lynch
but there’s more…
The A.I. Rush and the Ultimate Bubble
Since the launch of Chat GPT in late 2022 there has been a rush towards everything A.I. The invention of generative A.I. is unleashing people’s imagination en masse — and almost no prediction can be considered too extreme.
And so, every company is forced to have an A.I. strategy and talk about it repeatedly. Naturally, this has increased business in the technology space: GPUs, Data Centers, Cloud, Infrastructure etc.
I contend that the theme of A.I. could become the ultimate bubble. Why? Because of the thinking aspect around the mass adoption of A.I.
If people start to believe that A.I. can fully replace human intelligence — then what is the need for humans? And if humans will one day be fully replaced, then there is no logical limit for how far A.I. can go.
So how can the invention and adoption of A.I. become a bubble?
Every Bubble Has a Flaw
George Soros on boom/bust processes:
“Every bubble has two components: an underlying trend that prevails in reality and a misconception relating to that trend. A boom-bust process is set in motion when a trend and a misconception positively reinforce each other. The process is liable to be tested by negative feedback along the way. If the trend is strong enough to survive the test, both the trend and the misconception will be further reinforced. Eventually, market expectations become so far removed from reality that people are forced to recognize that a misconception is involved. A twilight period ensues during which doubts grow, and more people lose faith, but the prevailing trend is sustained by inertia….Eventually a point is reached when the trend is reversed; it then becomes self-reinforcing in the opposite direction.”
Soros here explains that every bubble (i.e. boom/bust process) has two components, which become positively self-reinforcing in the boom stage and then self-defeating in the bust stage. They are:
1) The underlying trend, in this case the mass adoption of A.I. — which is a real trend with true applications that carry benefits for mankind, but at the same time benefits which we do not fully comprehend. Let’s assume that the underlying trend is roughly represented by the EPS related to A.I. business.
2) The misconception is that our thoughts and expectations surrounding A.I. do not affect the fundamentals (EPS trends) that we are supposed to passively understand. We seem to believe that the business fundamentals of A.I. are irrespective of our thoughts and ideas on the matter.
While the underlying trend takes time to show its effects and power (e.g. like in the case of the mass adoption of the internet) — the expectations relating to that trend are immediately reflected in stock prices.
The delta between the two can be understood as the prevailing bias, the bigger the delta between expectations and the underlying trend, the bigger the bias.
In the case shown above: we can say that EPS are the fundamentals and the Stock Prices are the perception of the fundamentals, or the perception of reality. The difference between the two is the prevailing bias, however the prevailing bias can influence the EPS and the EPS can in turn affect the Stock Prices. This short circuit can be done in a myriad of ways different in each case. Of course, the model above can be used for cases other than stock prices and EPS.
Excerpt from:

Rampant Stock Expectations
The Nasdaq 100 has returned 54.5% since November 29th, 2022 (one day before the official launch of Chat GPT). This is a great return and naturally index investors are ecstatic — but what lies under the hood of these seemingly phenomenal returns?

Nvidia, Broadcom and AMD account for 25% of that gain — as they returned 345%, 152% and 130% respectively. Microsoft contributed 14% to the index as re-ignited excitement on its Cloud Azure AI offering propelled the stock higher. Meta Platforms contributed another 12% as cost cutting helped its bottom line massively (unrelated to A.I.)
These 5 names account for a cumulative 52% in positive return out of the total 54% that the index returned.
Ok Philo, but does that make it a bad thing?
It makes it a bad thing if the expectations priced in these stocks are overly ambitious and frothy. As we have explained above, Nvidia (a semiconductor business which has historically proven to be cyclical) is benefitting massively from the A.I. rush and currently making the big bucks.
But market expectations are using this cyclical upswing to bid valuations even higher, rather than lower (if they were to adjust for cyclicality). This means stock market expectations have become unhinged amidst this A.I. rush.
Where is the Reflexive Connection?
Microsoft is competing in the Cloud space with Amazon, Google et al. Naturally wanting to have the best AI offering, Microsoft decided to partner up with Sam Altman’s Open AI — and find ways to integrate Open AI to its Azure offering (which it’s already doing).
In order to “control” Open AI and extend a previously-created partnership, Microsoft invested $10 billion in the company in January 2023, but the investment consisted mainly of cloud compute purchases.
This basically means that Microsoft gave Open AI billions in “fun coupons”, that Open AI is then extending to the public so we can play on an A.I. chat bot, mainly for free. And this deal gave Open AI a valuation of $100 billion.
The fast-paced development of A.I. applications means everyone needs GPUs, Data Centers, Infrastructure and Hyperscale to keep up with the A.I. rush. Even if the current state of A.I. offerings have nothing (or not much) to offer a certain business (say a typical telco) they still need to have an A.I. strategy else their shareholders would crucify them.
Jump on the bandwagon everyone…
From the Microsoft Earnings call.
“Overall, we are seeing larger and more strategic Azure deals, with an increase in the number of billion-dollar-plus Azure commitments.”
Vodafone, for example, will invest $1.5 billion in cloud and AI services over the next 10 years as it works to transform the digital experience of more than 300 million customers worldwide. “
“We are seeing increased usage from AI-first startups like Moveworks, Perplexity, SymphonyAI, as well as some of the world’s largest companies. Over half of the Fortune 500 use Azure OpenAI today, including Ally Financial, Coca-Cola, and Rockwell Automation.”
For example, at CES this month Walmart shared how it’s using Azure OpenAI Service, along with its own proprietary data and models, to streamline how more than 50,000 associates work, and transform how its millions of customers shop. “
“Azure offers the top performance for AI training and inference and the most diverse selection of AI accelerators, including the latest from AMD and NVIDIA, as well as our own first party silicon, Azure Maia.”
“We now have 53,000 Azure AI customers. Over one-third are new to Azure over the past 12 months.”
From Google’s Sundar Pichai
“Today more than half of all funded generative AI startups are Google cloud customers,” Alphabet CEO Sundar Pichai said on the company’s earnings call Tuesday.”
From Amazon’s Andy Jassy
“Our generative AI business is growing very, very quickly,” Jassy said. “Almost by any measure, it’s a pretty significant business for us already.”
NVIDIA’s Self-Funded Demand
In fact, not only is Microsoft propping up their own revenues by funding Open AI with cloud compute credits, Nvidia is using its bumper profits to fund A.I. startups (which would then go on to buy GPUs, spend on Cloud, you know the drill by now etc.)
Naturally, Nvidia is trying to create the future that they envision. But there is a reality beyond our capacity to understand it, predict it or create it.
Dealroom reported that Nvidia participated in 35 deals in 2023, 6x more than in 2022. That number made Nvidia the biggest investor in A.I. startups for the year.
Last August, data centre company CoreWeave raised $2.3 billion in debt which was collateralised by Nvidia’s H100 chips. Basically, CoreWeave is a data centre company which came out of nowhere, raised funding (from investors including Nvidia) and is now using the H100 chips it bought as collateral, to raise debt and invest in its operations even further (including in even more H100 chips)
LEVERAGE times 2?
Which means that 1) not only are companies like Microsoft and NVIDIA using a type of equity leverage, in which they use their own cash to invest in companies like Open AI and CoreWeave — which then go on to achieve big valuations and raise even more money, causing them to generate even more business back to Microsoft, Nvidia and others in the A.I. domain.
But also that 2) companies like CoreWeave then use the chips that they bought from Nvidia using the capital that they raised as collateral to raise debt financing and, basically, buy even more chips.
By the way, to what extent are GPUs used for A.I. today — like GPUs used for Crypto Mining just a few years ago?..
To quote George Soros once more:
There are various pathways by which the mispricing of financial assets can affect the so-called fundamentals. The most widely travelled are those which involve the use of leverage-both debt and equity leveraging. The various feedback loops may give the impression that markets are often right, but the mechanism at work is very different from the one proposed by the prevailing paradigm.
I claim that financial markets have ways of altering the fundamentals and that may bring about a closer correspondence between market prices and the underlying fundamentals. Contrast that with the efficient market hypothesis, which claims that markets always accurately reflect reality and automatically tend towards equilibrium..
The back end?
We have established that there is a clear underlying trend towards A.I. and A.I.-related productivity tools. The rush into all things A.I. has propelled many technology stocks to ever higher valuations.
It’s clear that market participants are in most cases making decisions using considerations unrelated to value causing valuations to become frothy and unhinged.
David Einhorn has recently been quoted saying. “I view the market as fundamentally broken…Passive investors have no opinion about value. They’re going to assume everybody else has done the work.”
Well, you can take that and multiply it by 10X for A.I.
Now that valuations have come to reflect a future dominated by A.I., how will they live up to the expectations when demand for GPUs fades even just a little bit? When their prices then move from “forced buyer” (the market) to “forced seller” (the semi companies etc.) and collateral values drop? When VC money flowing into startups becomes fatigued? When returns from investing in these Gen AI startups isn’t that great? When new customer growth on the Cloud slows down? How will Fortune 500 companies react when they realise most of their A.I. spend does not result in bottom-line productivity boosts? Will people soon stop talking about A.I. (this much) when it goes out of fashion? What would happen if A.I. models (LLM and SLM) become commoditised? What would happen to the need for processing power when these language models become much more efficient?
Quoting Soros again from earlier in the article.
“Eventually, market expectations become so far removed from reality that people are forced to recognize that a misconception is involved. A twilight period ensues during which doubts grow, and more people lose faith, but the prevailing trend is sustained by inertia….Eventually a point is reached when the trend is reversed; it then becomes self-reinforcing in the opposite direction.”
The prevailing bias would then start to shrink and reverse, causing valuations to drop precipitously. This would halt the flow of funding into 1) A.I. startups 2) the purchasing of new GPUs 3) Cloud spend on A.I.-related projects etc.
What will A.I. fundamentals look like then?
The Test
Note that in a reflexive process, we never know what will happen beforehand. Ultimately, we are merely forming hypotheses and testing them with the market’s response.
Soros speaks a lot about “tests” when he is assessing his market theses. When a market is in an uptrend or boom phase, and there is a sharp sell-off, Soros considers the sell-off as a test of the overall trend.
The market (thesis) could pass the “test”, and then continue to go higher, which is often the case. Or the market thesis could fail the test and then enter into a new phase, usually a down trend.
I will keep following this theme closely and update subscribers accordingly.
Sincerely,
Philo 🦉
https://modelthinkers.com/mental-model/bullshit-asymmetry-principle